A Histogram represents the distribution of a numerical variable. A bar-chart is typically used to compare numeric values corresponding to categorical variables.
To construct a histogram:
- X-axis: Usually the range of values is binned. In other words, the entire range is divided into a series of intervals and each interval occupies a slot on the X axis.
- Y-axis: The number of times a value occurred in each interval is shown on the Y axis.
Example: Histogram of number of people who arrived at various time intervals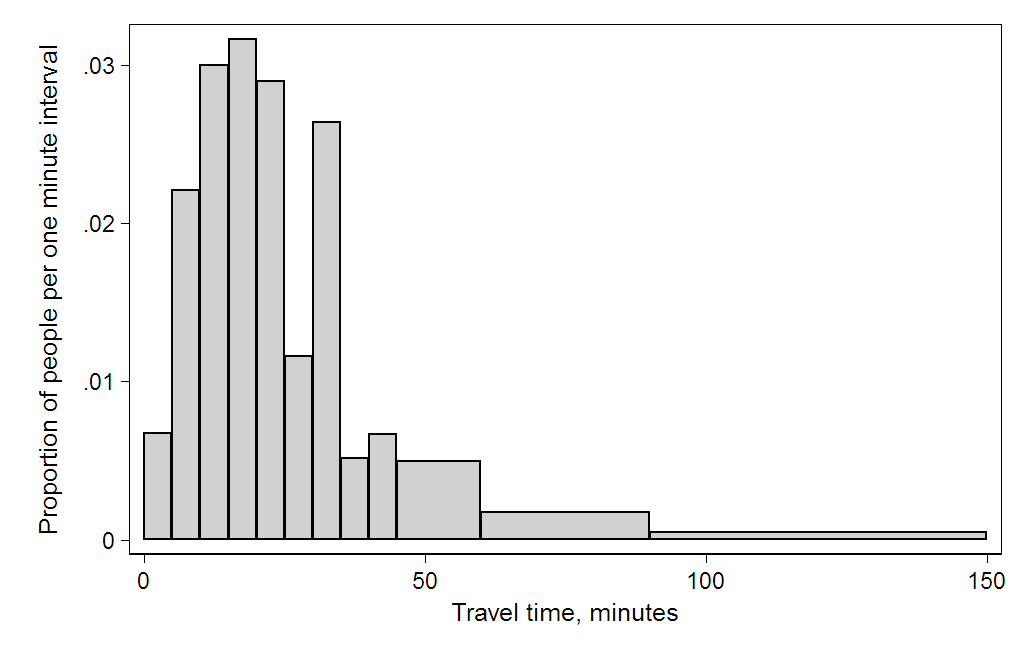
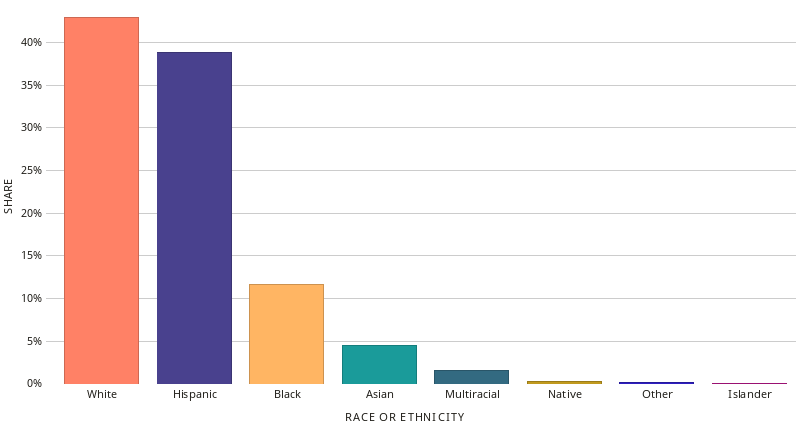
To construct a Vertical Barchart :
X axis: Categorical Labels
Y-axis : Numeric values corresponding to the categorical variable
Example: Comparing the percentage of population of various ethnicities