Simpsons Paradox occures when trends in aggregates are reversed when examining trends in subgroups. Data often has biases that are might might lead to unexpected trends, but digging deeper and deciphering these biases and looking at appropriate sub-groups leads to drawing the right insights.
Why does Simpson’s paradox occur ?
Arithmetically, when (a1/A1) < (a2/A2) and (b1/B1) < (b2/B2) we tend to think (a1+a2)/(A1+A2) < (b1+b2)/(B1+B2). But this is not always true!
Consider 18/19>19/20 and 80/400>19/100.
But (18+80)/(19+419)=0.233 is less than (19+19)/(20+100)=0.316
Simpson’s paradox in the context of correlations:
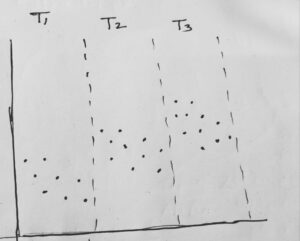
The picture on the left shows three groups of points. Each group of points seems to display negative correlation between the X and the Y coordinates. But when you look at the dataset as a whole, there seems to be a positive correelation. This is shown in the image in the right, where the best fit line overall has a positive slope, but the best fit line in each group has a negative slope.
Examples of Simpson’s Paradox
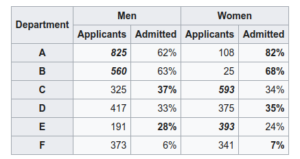
The Berkeley Gender Bias Example: During graduate admissions in the fall of 1973, It appeares that there was a higher percentage of males (44%) admitted to the Berkeley program than females (35%) of those who applied.
But when we look at the top 6 departments, most of them have a higher percentage of females admitted.
The hidden bias in the data: It turns out that females applied to departments with lower rates of acceptance.
Kidney Stone Treatment Example:
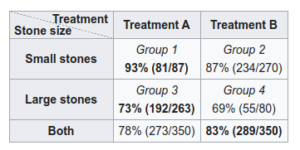
In the following example, there are two types of treatments A and B which were tried out on two groups of people – those with large kidney stones and those with small kidney stones. For both groups of people looks like treatment A was performing better than treatment B.
But when we look at the aggregate, treatment B has higher success rate!
The hidden bias in the data: This is possibly because treatment B (the inferior treatment) was given to people with smaller kidney stones and people with smaller kidney stones had higher success rate in general.
Economics: Demand vs Price Example:
We expect a negative correlation between demand and price. When price increases, we expect the demand to decrease. However, one might observe demand and price to be correlated over a period of several years!
The hidden biases: This is because in each time period they were negatively correlated, but when put together, there could be external factors such as inflation, and a bunch of other factors that could have caused both of them to go up overall.
How does Simpson’s Paradox influence decision taking?
Simpsons paradox tells us that it is important to dive deeper into the data and look at trends in subgroups that make sense before taking decisions to uncover hidden biases. The kind of subgroups we look at might have an impact on the kind of trends we see – and picking the right subgroups to uncover these hidden biases should come from the domain understanding.
References and Resources:
Pearl, Judea (December 2013). “Understanding Simpson’s paradox” (PDF). UCLA Cognitive Systems Laboratory, Technical Report R-414.
Clifford H. Wagner (February 1982). “Simpson’s Paradox in Real Life”. The American Statistician. 36 (1): 46–48. doi:10.2307/2684093. JSTOR 2684093.
P.J. Bickel, E.A. Hammel and J.W. O’Connell (1975). “Sex Bias in Graduate Admissions: Data From Berkeley” (PDF). Science. 187 (4175): 398–404. doi:10.1126/science.187.4175.398. PMID 17835295.
C. R. Charig; D. R. Webb; S. R. Payne; J. E. Wickham (29 March 1986). “Comparison of treatment of renal calculi by open surgery, percutaneous nephrolithotomy, and extracorporeal shockwave lithotripsy”. Br Med J (Clin Res Ed). 292 (6524): 879–882. doi:10.1136/bmj.292.6524.879. PMC 1339981.


