K-means Clustering Recap
Clustering is the process of finding cohesive groups of items in the data. K means clusterin is the most popular clustering algorithm. It is simple to implement and easily available in python and R libraries. Here is a quick recap of how K-means clustering works.
- Choose a value of K
- Initialize K points as cluster centers
- Until termination criterion:
- Assign each point to the cluster corresponding to the closest cluster center
- Update cluster ceners as the centroids of the newly formed clusters
An important question that arises when using is K-means is: How do we find the optimal value of K?
How to find the number of clusters in K-means?
K is a hyperparameter to the k-means algorithm. In most cases, the number of clusters K is determined in a heuristic fashion. Most strategies involve running K-means with different values of K – and finding the best value using some criteron. The two most popular criteria used are the elbow and the silhouette methods.
Elbow Method
The elbow method involves finding a metric to evaluate how good a clustering outcome is for various values of K and finding the elbow point. Initially the quality of clustering improves rapidly when changing value of K, but eventually stabilizes. The elbow point is the point where the relative improvement is not very high any more. This is shown pictorially in the two graphs below for the metric average within cluster sum of squares.
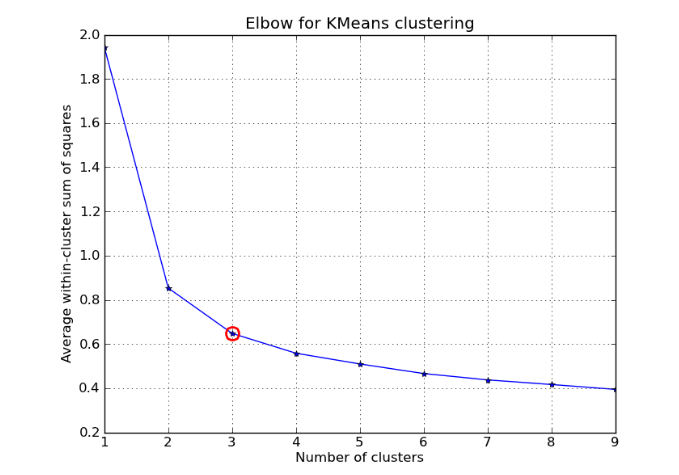
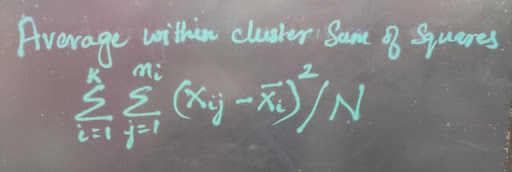
Two popular metrics that are used are the average within cluster sum of squares and the percentage of variance explained. These metrics are elaborated in the pictures below.
The average within cluster sum of squares measures how cohesive the clusters are.
 The percentage of variance measures how cohesive the clusters are, however normalizing with the total variance in the dataset in the demonimator.
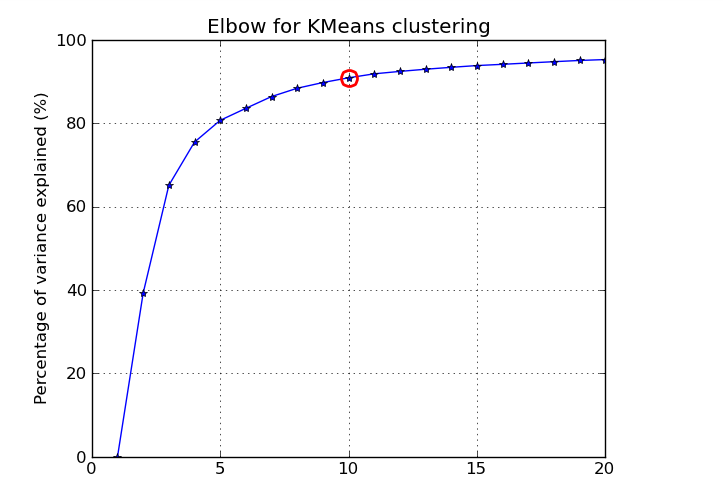
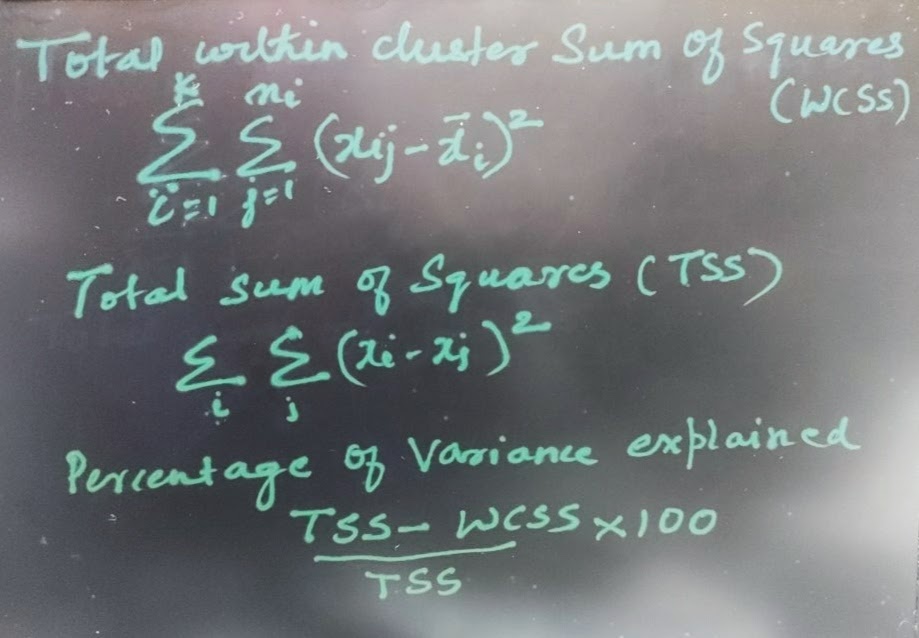 The picture below shows the elbow curve and the elbow point for the percentage of variance explained metric.
 Silhouette Method
The silhouette technique can be summarized as follows where we first find the silhouette coefficient for each point in the dataset:
- Let a= mean intra-cluster distance
- Let b= mean nearest-cluster distance
- Silhouette Coefficient for the point = (b-a)/max(a,b)
Silhouette Coefficient for Dataset= Mean Silhouette Coefficient over points
This is a more expensive method compared to elbow. To visualize pictorially, we see in the first picture how the mean intra-cluster distance is being computed for the point in the center of the cluster. This is the average distance of a secific point to all other points in the cluster. The mean nearest-cluster distance on the other hand is the distance of a specific point to each point in its nearest cluster other than the one it is assigned to. This is shown pictorially in the second picture below.


Python Code and references
The silhouette method can be readily implemented in sci-kit learn. Check out the following link:
https://scikit-learn.org/stable/auto_examples/cluster/plot_kmeans_silhouette_analysis.html#