
Often in data science, we want to understand how one variable is related to another. These variables could be features for an ML model, or sometimes we might want to see how important afeature is in determining the target we are trying to predict.
Both covariance and correlation can be used to measure the direction of linear relationship between a set of variables. Correlation is a normalized version of covariance that indicates not just the direction, but the strength of linear relationship. Let us understand this better.
What is Covariance?
Covariance between two variables measures the direction of linear relationship between a set of variables.
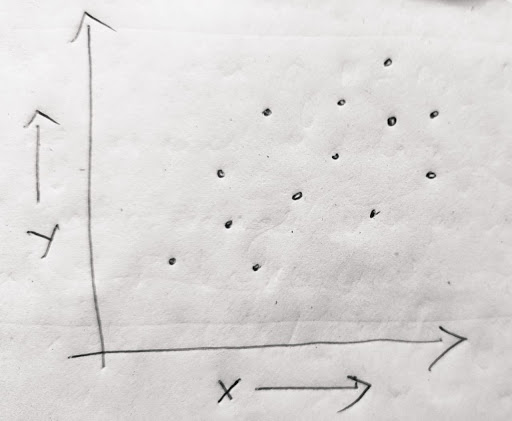
For instance, in the picture above, we see that as the value of X increases, the valye of Y increases as well. This means that there is a dependence between X and Y. This notion can be formalized with the concept of covariance.
The following is the mathematical definition of covariance :
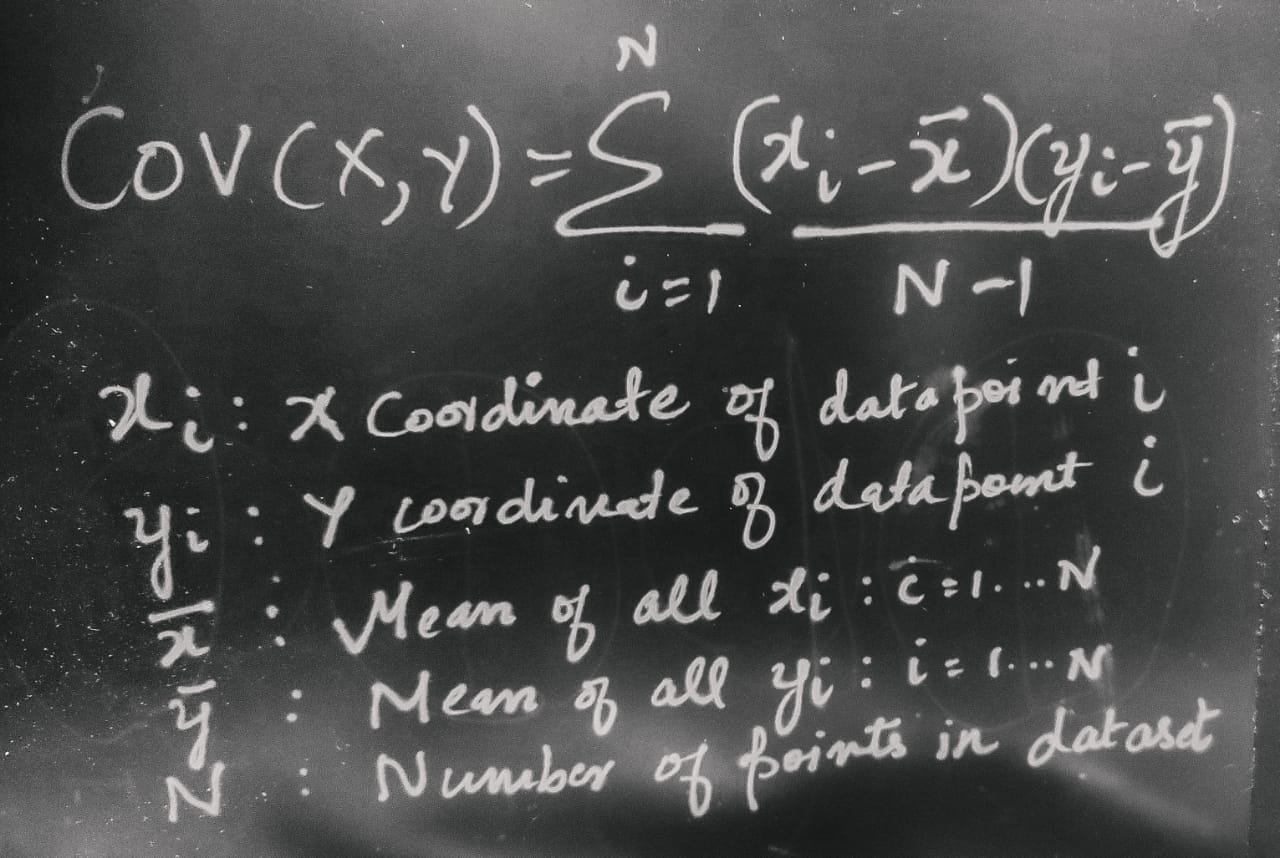
A positive value of covariance indicates that one variable increases with the other, while a negative value indicates vice versa. It can take values between negative infinity to positive infinity.
However a high value of covariance does not necessarily mean a strong relationship. Thus comes Correlation to the rescue!
What is Correlation?
Correlation helps measure both direction and strength of linear relationship between a pair of variables. Correlation is a covariance normalized by standard deviation of both the respective random variables. The formal definition of correlation (pearsons correlation coefficient) follows:
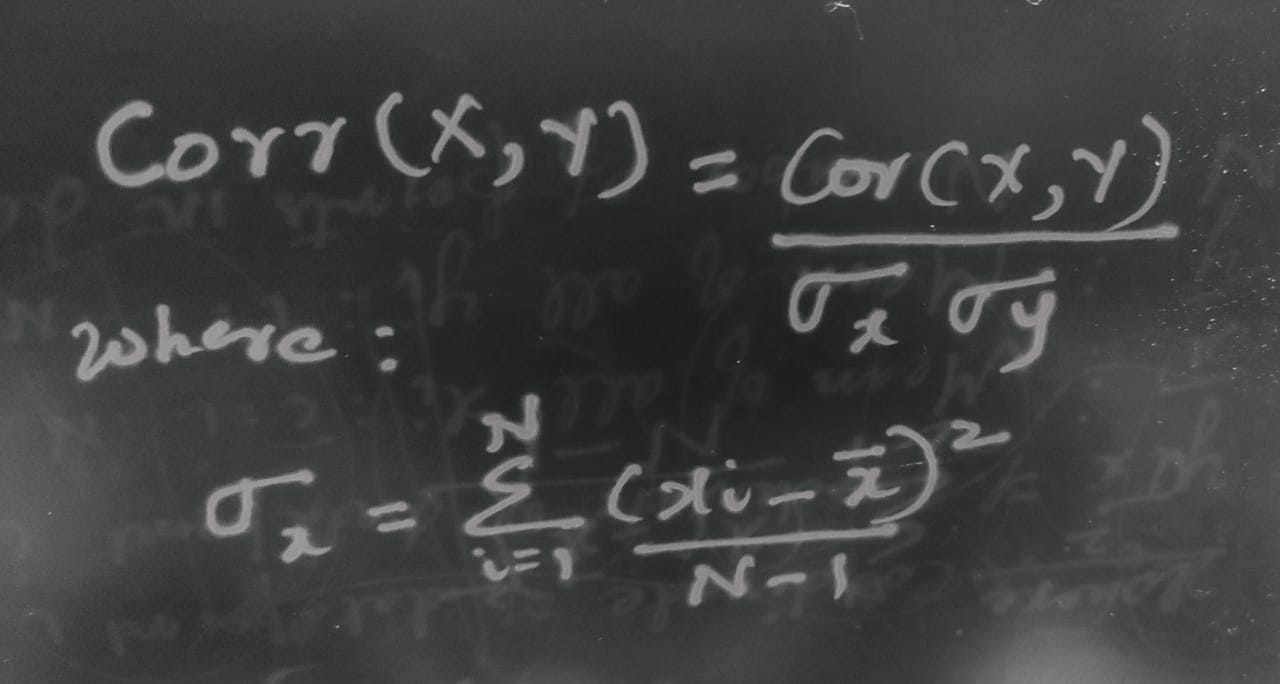
Since the correlation coefficient is a normalized version, it lies between -1 and 1. Hence a value close to 1 indicates a strong positive correlation, while a value close to zero indicates a lack of correlation and a value close to -1 indicates a strong negative correlation. Hence one can measure the strength of the relationship as well as the direction with the correlation coefficient.
There are multiple variations of a correlation coefficents : The Pearsons correlation coefficent, the Spearman’s Rho and the Kendall’s Tau. We will restrict our discussion to the Pearsons correlation coefficient, that is most popularly used.
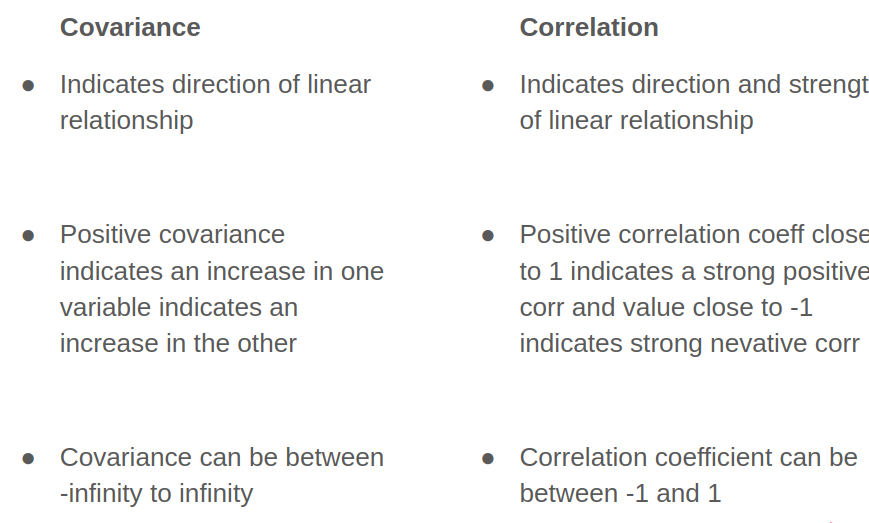
Summary of Differences between Covariance and Correlation:
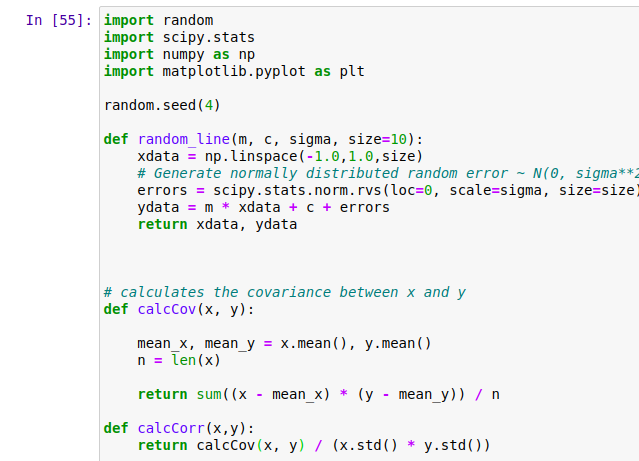
Python Code With Examples:
To appreciate the difference between the covariance and correlation – here is a small example. The following code generates sample data followed by functions that compute the covariance and correlation.
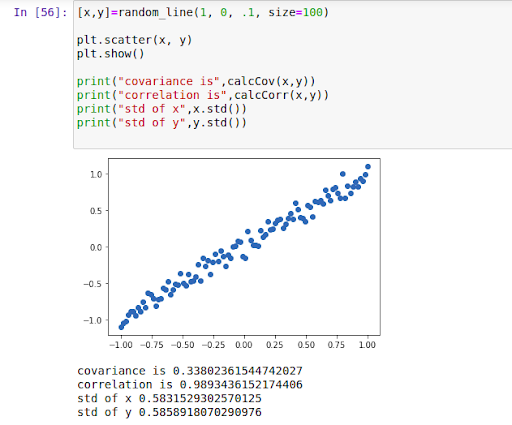
We now look at the covariance and correlation of the first data set geenrated – the points are along a straight line with a positive slope indicating a strong positive correlation. But we note that the covariance is not so high. This is because the variance along the X and Y directions is not high to begin with. The value of X and Y all lie between -1 and 1.
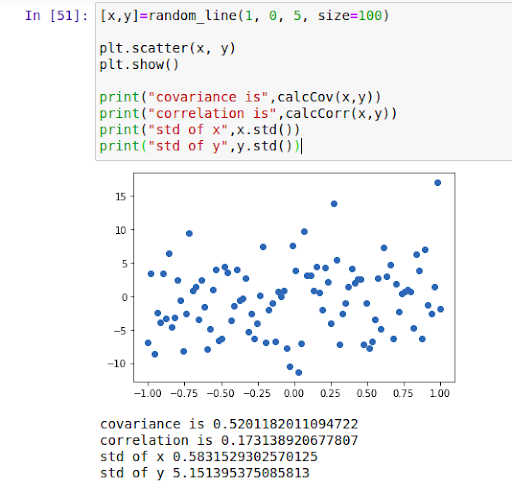
In the next example, we see that the points show a low correlation, without much discernable pattern. However the correlation is high since the variance along Y direction is high. Y values are spread from -10 to 15.
Rerefences:
https://en.wikipedia.org/wiki/Covariance_and_correlation